
Technical Scope: Key levels to watch for on JPY pairs
April 22, 2026 at 9:50 AM
Technical Analysis Today: EUR/USD, GBP/USD, Gold, WTI Crude & S&P 500 Outlook
Welcome to today’s edition of The Technical Scope, your twice-weekly guide to the evolving landscape of global markets through the lens of technical analysis. This report focuses on pure price action, highlighting key supply and demand zones, tracking momentum shifts, and identifying potential trading opportunities. Each edition covers major assets, offering a broad view of how currencies, commodities, and equities are performing. When market conditions present interesting setups, additional instruments will also be analyzed to provide deeper insight and actionable context.
Today’s edition presents our technical analysis of the following key assets: EUR/USD, GBP/USD, Gold, WTI Crude, and the S&P500. In addition, we highlight selected opportunities where technical conditions stand out, including additional instruments USD/JPY and GBP/JPY.
EUR/USD Technical Analysis
EUR/USD 4-Hour Chart
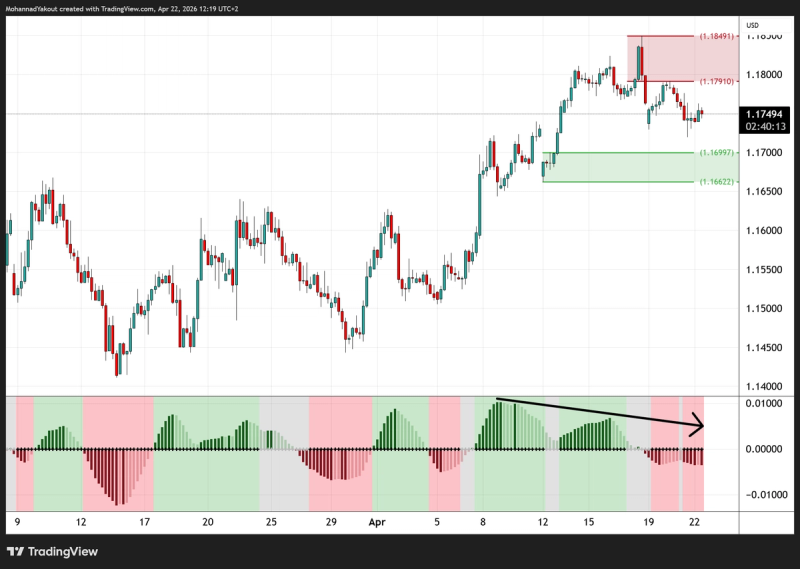
The current H4 timeframe chart on EUR/USD indicates a prevailing uptrend, with price action steadily advancing from the 1.1500 region in a well-defined higher-high, higher-low structure. Price recently printed a high near 1.1850, from which a corrective move has developed, accompanied by signs of potential exhaustion, reflected in a bearish divergence on the momentum indicator.
Despite this short-term pullback, the broader market structure remains bullish. The decline from 1.1850 to the current price area around 1.1750 is therefore best interpreted as a retracement within the dominant uptrend. The nearest demand zone is located between 1.1660 and 1.1700.
From a price action perspective, a continuation lower into this demand area remains plausible. Should bullish reversal signals emerge from this zone, a resumption of the upward trend could follow, with a potential move back toward the previous high at 1.1850, and possibly beyond.
GBP/USD Technical Analysis
GBP/USD 4-Hour Chart
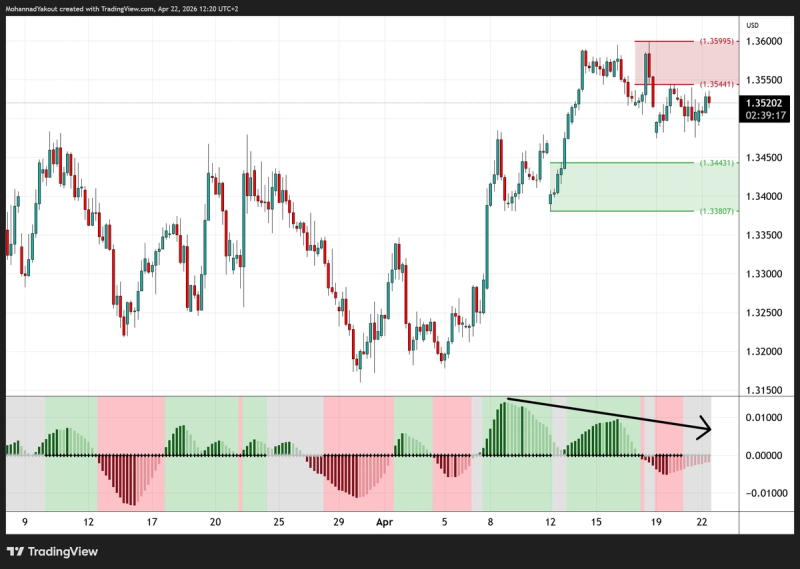
The current H4 timeframe chart on GBP/USD indicates a transition from a bullish phase into a period of exhaustion. Price recently reached a supply zone between 1.3544 and 1.3600, where it encountered selling pressure. This cooling of sentiment is clearly reflected in the momentum indicator, which shows a bearish divergence, while price attempted to hold its highs, the indicator printed lower highs.
The broader market structure suggests that the recent rally is losing steam. Consequently, a move lower is expected to seek liquidity in the nearest demand zone, located between 1.3380 and 1.3440. Traders should monitor for a sustained break below local support to confirm this descent toward the green demand area.
Gold Technical Analysis
Gold 4-Hour Chart
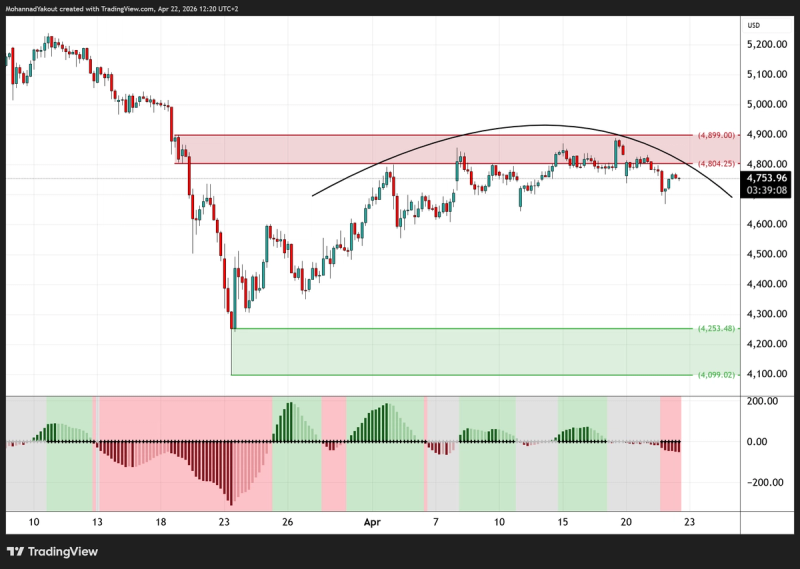
The H4 chart for Gold shows price action struggling to sustain momentum within the 4,800 – 4,900 supply range. The formation of a rounding top, as indicated by the black arc, suggests a shift in market sentiment from bullish to bearish. This structural "curving" often precedes a trend reversal as buyers fail to push prices to new highs, in addition to the momentum indicator showing clear signs of exhaustion.
Given this inability to break through the overhead resistance, the path of least resistance appears to be to the downside. A move lower toward the significant demand zone situated between 4,100 and 4,250 is the primary technical expectation. A decisive close below current consolidation levels around 4,700 would validate this bearish outlook.
WTI Crude Technical Analysis
WTI Crude 4-Hour Chart
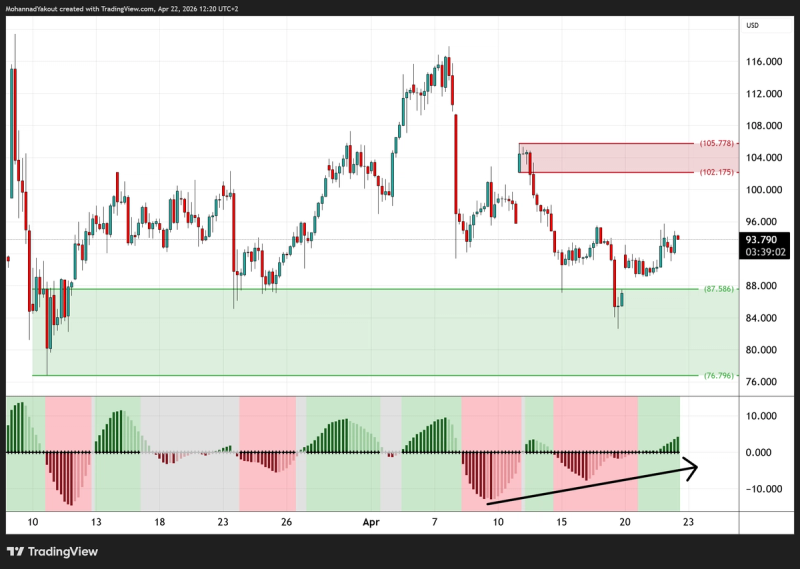
The H4 chart for WTI Crude indicates a potential reversal of the recent downtrend, which is part of a larger sideways move. Following a test of the demand zone near the 84.00 – 87.50 region, price has begun to stabilize. Crucially, the momentum indicator reveals a bullish divergence, with the indicator making higher lows while price action remains relatively flat, suggesting that selling pressure is exhausted and accumulation is slightly occurring.
The technical outlook favors a move higher as buyers regain control. The immediate objective for this upward move is the supply zone located between 102.17 and 105.77. A break above recent swing highs around 95.00 would confirm the shift in momentum and pave the way for a test of this overhead resistance.
S&P500 Technical Analysis
S&P500 4-Hour Chart
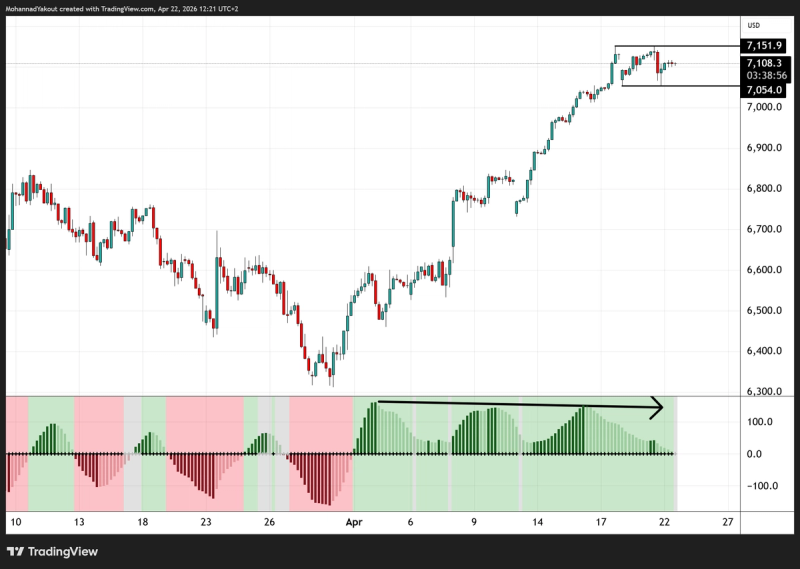
The S&P 500 is currently trading in a tight consolidation zone on the H4 timeframe, constrained by resistance at 7,152 and support at 7,054. While the long-term trend remains upward, the momentum indicator shows a persistent double bearish divergence (indicated by the black arrow), suggesting that the trend is overextended and lacks the "fuel" for a strong continuation.
Two scenarios are currently in play:
- Bullish Break: A move above 7,152 might lead to a slight extension, but the weak momentum makes this a low-conviction trade.
- Bearish Break (Preferred): A break below the 7,054 support would likely signal the start of a deep and necessary retracement, allowing the market to reset and gather much needed liquidity before any further sustainable gains.
USD/JPY Technical Analysis
USD/JPY 4-Hour Chart
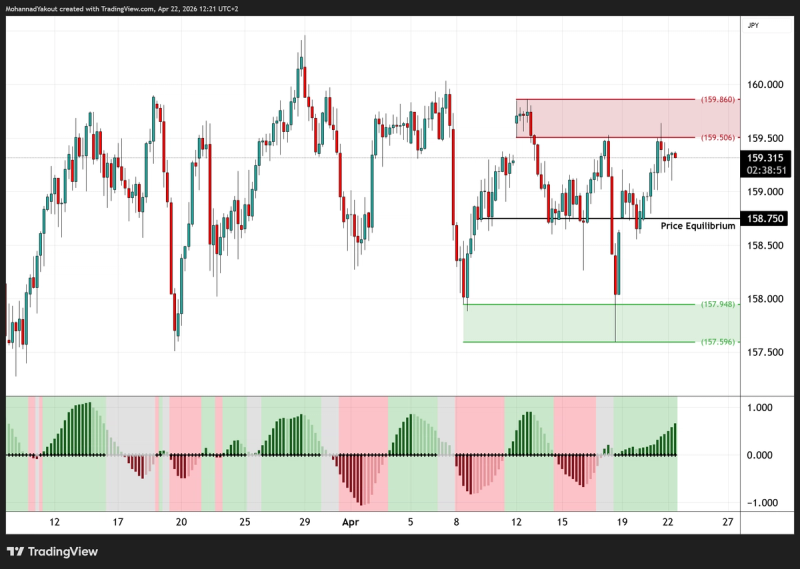
The H4 timeframe for USD/JPY shows the pair retreating from a supply zone located between 159.50 and 160. After a period of slight appreciation, the price is now entering a corrective phase. Current price action is hovering just above the 158.75 Price Equilibrium level, which serves as the first logical target for sellers.
Should the price fail to find support at the equilibrium line, a deeper move toward the demand zone between 157.60 and 158.00 is expected. The recent rejection from the red supply zone confirms that the overall trend is a sideways one, where the best-case scenario is a continuation of the current ‘ping-pong’ trade between supply and demand, with high volatility expected around the equilibrium levels.
GBP/JPY Technical Analysis
GBP/JPY 4-Hour Chart
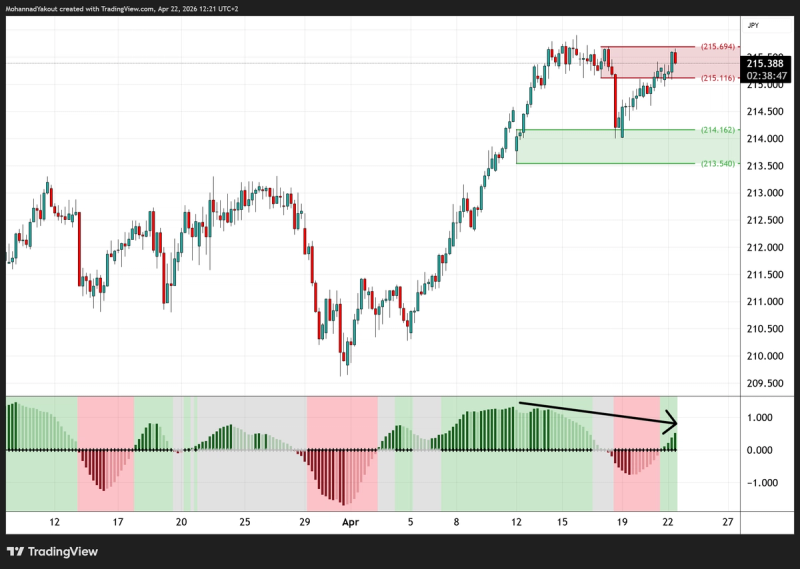
The current H4 chart on GBP/JPY indicates that the pair might face heavy resistance near the 215.70 level. This area forms the upper boundary of the current supply zone (215.10 – 215.70). The momentum indicator supports a bearish thesis, displaying a clear downward slope (divergence) while price remains at elevated levels.
As long as price action holds below the 215.70 mark, the technical setup remains bearish. We can expect a move lower to target the demand zone located between 213.50 and 214.20. A failure to break the supply zone on the next few candles would increase the probability of a retracement toward that green demand area.
This material is a marketing communication provided for informational purposes only and does not constitute investment advice, recommendation, or an offer or solicitation to trade. Any market analysis, opinions, or forecasts are based on publicly available information and do not constitute independent investment research. Past performance and forecasts are not reliable indicators of future results. Scope Markets accepts no liability for any loss arising from reliance on this information.
Related Articles

Technical Scope: The Sideways trading continues
By Mohanad Yakout
Welcome to today’s edition of The Technical Scope, your twice-weekly guide to the evolving landscape of global markets through the lens of technical a...
Read More
Market Analysis
Swing Trading

Technical Scope: No changes in technicals, or fundamentals!
By Mohanad Yakout
Welcome to today’s edition of The Technical Scope, your twice-weekly guide to the evolving landscape of global markets through the lens of technical a...
Read More
Market Analysis
Technical Analysis
Swing Trading

Technical Scope: The Strong Dollar Effect
By Mohanad Yakout
Welcome to today’s edition of The Technical Scope, your twice-weekly guide to the evolving landscape of global markets through the lens of technical a...
Read More
Market Analysis
Technical Analysis
Technical Scope: Markets stuck in a sideways range
By Mohanad Yakout
Welcome to today’s edition of The Technical Scope, your twice-weekly guide to the evolving landscape of global markets through the lens of technical a...
Read More
Market Analysis
XAUUSD
USDJPY
US 500
Trend Following
Technical Analysis
Swing Trading
Support And Resistance

Stop Trading the News, Start Trading the Oil Cargo
By Victor Golovtchenko
When you see a Reuters headline that tells you OPEC+ is "completing the series of symbolic quota hikes," what exactly are you trading? When the Irania...
Read More
Market Analysis
Oil
US Oil
UK oil
WTI
Brent Crude
Trading

Technical Scope: Markets Mixed Ahead of Key Developments
By Mohanad Yakout
Welcome to today’s edition of The Technical Scope, your twice-weekly guide to the evolving landscape of global markets through the lens of technical a...
Read More
Market Analysis
XAUUSD
USDJPY
US 500
Trend Following
Technical Analysis
Swing Trading
Support And Resistance
Technical Scope: Key Levels & Market Outlook ahead of NFP Data
By Mohanad Yakout
Welcome to today’s edition of The Technical Scope, your twice-weekly guide to the evolving landscape of global markets through the lens of technical a...
Read More
Market Analysis
Chart Patterns
Candlestick Patterns
Day Trading
GBPUSD
Gold
NFP
Non Farm Payrolls
EURUSD
Oil
S&P 500
US 500
USDJPY
XAUUSD
The state of Hormuz: oil price action is not the story
By Victor Golovtchenko
Another month, another week, another batch of headlines, and new all-time highs for US stock markets might not be the news one awaits when they see th...
Read More
Market Analysis
Oil
WTI
Brent Crude
Strait of Hormuz
UAE
OPEC

Beyond oil & gold: sector rotation from AI-centric to energy-centric
By Victor Golovtchenko
The vulnerability of the Strait of Hormuz which is handling 20% of global oil flows and a massive share of Qatar’s liquified natural gas (LNG) exports...
Read More
Market Analysis
Stocks
Energy
Tesla