
Technical Scope: Markets Mixed Ahead of Key Developments
May 12, 2026 at 1:13 PM
Technical Analysis Today: EUR/USD, GBP/USD, Gold, Brent Crude & S&P 500 Outlook
Welcome to today’s edition of The Technical Scope, your twice-weekly guide to the evolving landscape of global markets through the lens of technical analysis. This report focuses on pure price action, highlighting key supply and demand zones, tracking momentum shifts, and identifying potential trading opportunities. Each edition covers major assets, offering a broad view of how currencies, commodities, and equities are performing. When market conditions present interesting setups, additional instruments will also be analyzed to provide deeper insight and actionable context.
Today’s edition presents our technical analysis of the following key assets: EUR/USD, GBP/USD, Gold, Brent Crude, and the S&P500. In addition, we highlight selected opportunities where technical conditions stand out, including an additional instrument USD/JPY.
EUR/USD
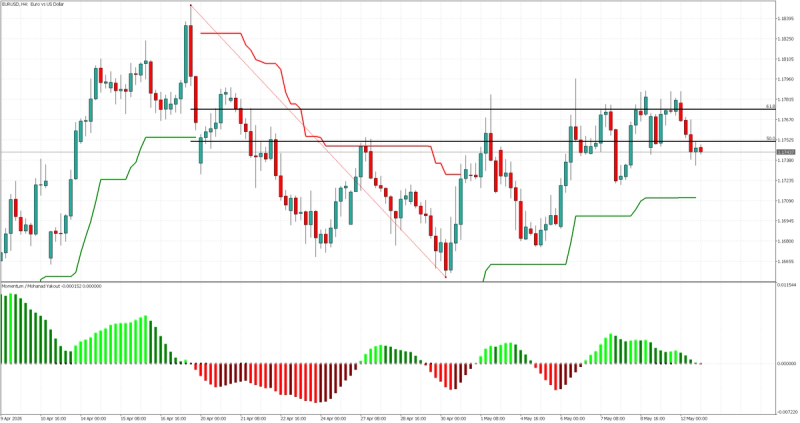
4-Hour Chart
The EUR/USD H4 chart shows a period of weak sideways consolidation following a recent relief rally. Price action has faced a clear rejection from the 1.1780 (61.8%) and 1.1750 (50.0%) Fibonacci retracement levels, which are currently acting as a firm overhead ceiling.
The momentum indicator reinforces this bearish outlook; while price attempted to hold higher levels, the green histograms have significantly diminished, signaling bullish exhaustion. Furthermore, a subtle bearish divergence has formed, suggesting that the upward move lacks the underlying strength to break through the current resistance. We expect a move lower as sellers regain control.
GBP/USD
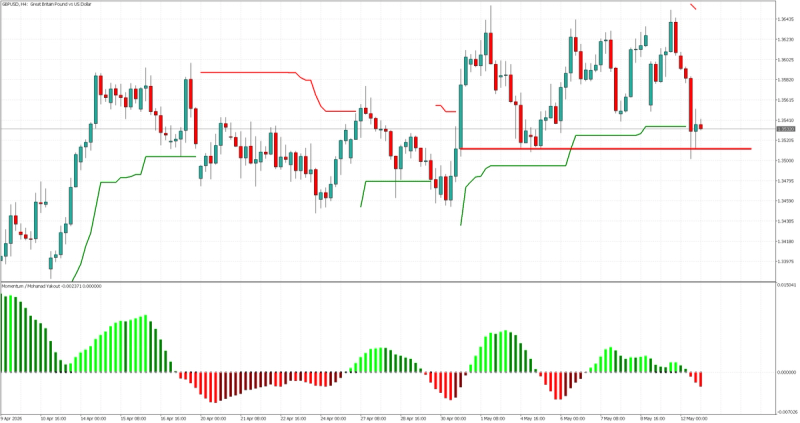
4-Hour Chart
The Cable is currently locked in a sideways range, showing a lack of decisive direction in the short term. However, price is currently hovering just above a significant support zone near 1.3510.
While the momentum histograms remain in the red, their contraction suggests that selling pressure is beginning to wane at these lower levels. Given the proximity to this support, and generally the directionless trading we witness this week, a weak bullish bounce is expected off the 1.3510 mark. Traders should look for price to stabilize here before a corrective move back toward the middle of the recent range.
Gold
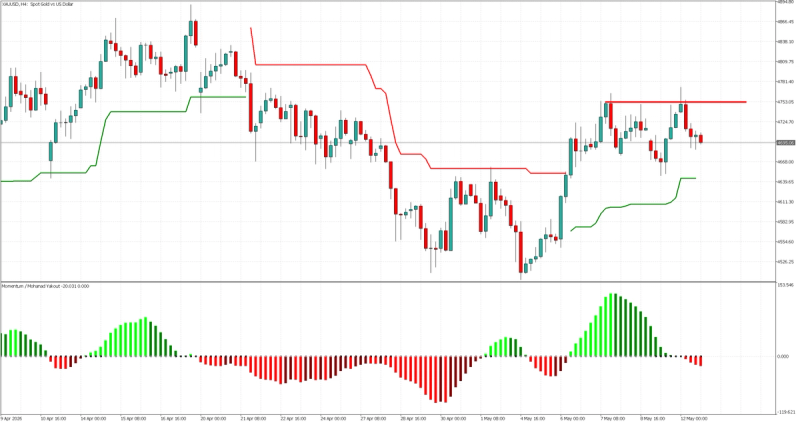
4-Hour Chart
Gold has encountered a recent resistance barrier near the $4,750 level. Recent attempts to sustain a breakout above this zone were met with swift rejection, as indicated by the long upper wicks on the candles.
The momentum indicator supports a reversal thesis, with green histograms rapidly retreating toward the zero line, marking a shift in sentiment. With the "ceiling" firmly established at 4750, the path of least resistance appears to be to the downside. We anticipate a move lower toward the $4,640 liquidity zone in the coming sessions.
Brent Crude
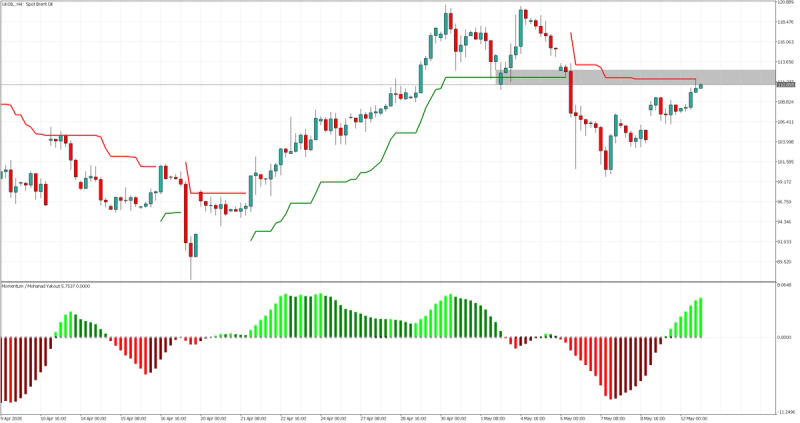
4-Hour Chart
Brent Crude recently underwent a significant structural shift after breaking below the key psychological and technical support level around $110.00. Price is currently in a "retest" phase, pulling back to verify this level as new resistance (the grey supply zone).
If bearish price action, such as an engulfing candle or a failure to close above 112.00, emerges during this retest, it would confirm the breakdown. In this scenario, we expect a bearish continuation that could see prices sliding back toward the $100.00 mark as the broader retracement resumes.
S&P 500
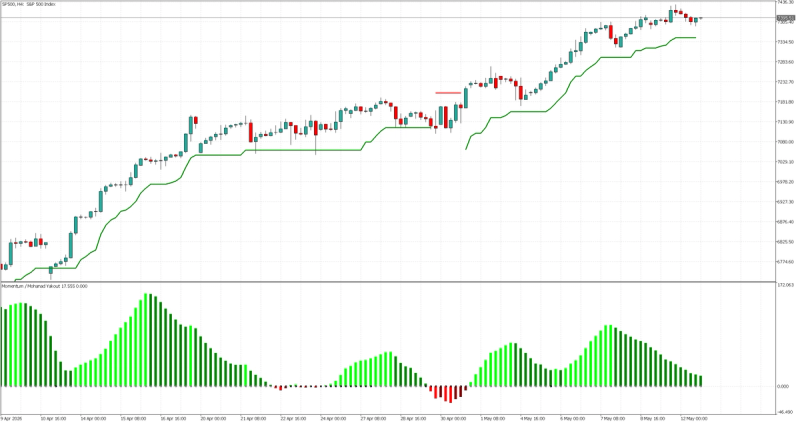
4-Hour Chart
The S&P 500 remains in a textbook uptrend, characterized by higher highs and higher lows, well-supported by the green super-trend-following indicator. Fundamental tailwinds from bullish Q1 earnings continue to provide a solid floor for the index.
Momentum remains in the green, indicating that buyers are still very much in the driver's seat, although we have seen weaker momentum in the last few sessions. Under these conditions, any short-term technical pullbacks are very much expected, but should be viewed as high-probability buying opportunities. The immediate objective remains a push into uncharted territory, with targets set at a new all-time high around the 7,500 point level.
USD/JPY
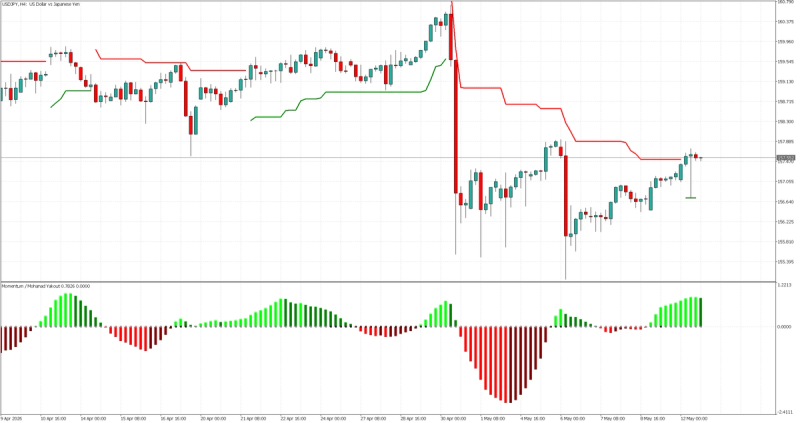
4-Hour Chart
Following a volatile recovery, USD/JPY is nearing a critical resistance zone around 158.00. Price action is showing signs of friction as it approaches the resistance zone, suggesting that the recent recovery may be overextended.
While the momentum indicator is currently positive, the recent price action doesn’t show strength, hinting at a potential peak in buying interest. We expect a short-term pullback lower toward the 157.00 level, as the pair looks to find a more sustainable base before attempting any further moves higher.
This material is a marketing communication provided for informational purposes only and does not constitute investment advice, recommendation, or an offer or solicitation to trade. Any market analysis, opinions, or forecasts are based on publicly available information and do not constitute independent investment research. Past performance and forecasts are not reliable indicators of future results. Scope Markets accepts no liability for any loss arising from reliance on this information.
Related Articles

Technical Scope: Markets Await Fresh Catalysts
By Mohanad Yakout
Welcome to today’s edition of The Technical Scope, your twice-weekly guide to the evolving landscape of global markets through the lens of technical a...
Read More
Market Analysis
Swing Trading
Technical Analysis

Technical Scope: Markets see trend continuations
By Mohanad Yakout
Welcome to today’s edition of The Technical Scope, your twice-weekly guide to the evolving landscape of global markets through the lens of technical a...
Read More
Market Analysis
Swing Trading
Technical Analysis

Technical Scope: Price Action Ahead of the Peace Summit
By Mohanad Yakout
Welcome to today’s edition of The Technical Scope, your twice-weekly guide to the evolving landscape of global markets through the lens of technical a...
Read More
Market Analysis
Price Action
Swing Trading
Technical Analysis

Technical Scope: The Sideways trading continues
By Mohanad Yakout
Welcome to today’s edition of The Technical Scope, your twice-weekly guide to the evolving landscape of global markets through the lens of technical a...
Read More
Market Analysis
Swing Trading
Technical Scope: No changes in technicals, or fundamentals!
By Mohanad Yakout
Welcome to today’s edition of The Technical Scope, your twice-weekly guide to the evolving landscape of global markets through the lens of technical a...
Read More
Market Analysis
Technical Analysis
Swing Trading
Technical Scope: The Strong Dollar Effect
By Mohanad Yakout
Welcome to today’s edition of The Technical Scope, your twice-weekly guide to the evolving landscape of global markets through the lens of technical a...
Read More
Market Analysis
Technical Analysis
Technical Scope: Markets stuck in a sideways range
By Mohanad Yakout
Welcome to today’s edition of The Technical Scope, your twice-weekly guide to the evolving landscape of global markets through the lens of technical a...
Read More
Market Analysis
XAUUSD
USDJPY
US 500
Trend Following
Technical Analysis
Swing Trading
Support And Resistance

Stop Trading the News, Start Trading the Oil Cargo
By Victor Golovtchenko
When you see a Reuters headline that tells you OPEC+ is "completing the series of symbolic quota hikes," what exactly are you trading? When the Irania...
Read More
Market Analysis
Oil
US Oil
UK oil
WTI
Brent Crude
Trading
Technical Scope: Key Levels & Market Outlook ahead of NFP Data
By Mohanad Yakout
Welcome to today’s edition of The Technical Scope, your twice-weekly guide to the evolving landscape of global markets through the lens of technical a...
Read More
Market Analysis
Chart Patterns
Candlestick Patterns
Day Trading
GBPUSD
Gold
NFP
Non Farm Payrolls
EURUSD
Oil
S&P 500
US 500
USDJPY
XAUUSD
The state of Hormuz: oil price action is not the story
By Victor Golovtchenko
Another month, another week, another batch of headlines, and new all-time highs for US stock markets might not be the news one awaits when they see th...
Read More
Market Analysis
Oil
WTI
Brent Crude
Strait of Hormuz
UAE
OPEC