
Stop Trading the News, Start Trading the Oil Cargo
May 14, 2026 at 1:37 PM
When you see a Reuters headline that tells you OPEC+ is "completing the series of symbolic quota hikes," what exactly are you trading? When the Iranian Fars news agency announces Chinese vessels are crossing the Strait of Hormuz, what tonnage is on those vessels? When Rubio tells NBC that Trump and Xi "found common ground on Iran" and then in the same breath says "we're not asking for China's help" – which one of those statements moves a single barrel from Ras Tanura to Rotterdam?
This is the problem with the modern oil trader – you’re long or short headlines and you're not long or short oil. But that’s valid for every market and the mechanisms of impact on trader behaviour should be a subject of a more technical article. Speaking of technical – let’s explore the current key levels in both WTI and Brent spot CFDs.
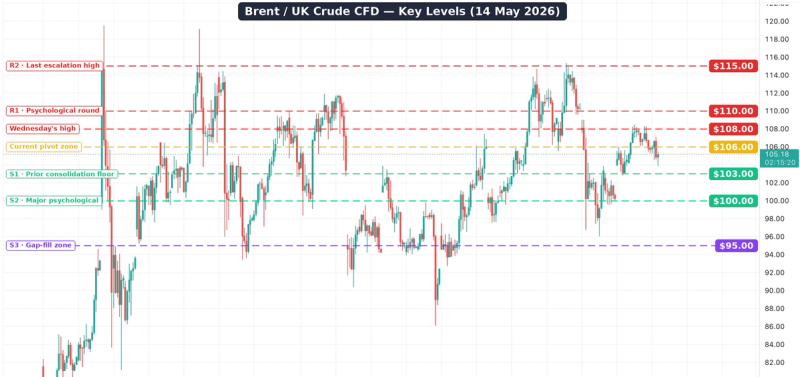
Brent Crude Key Levels 14th of May 2026
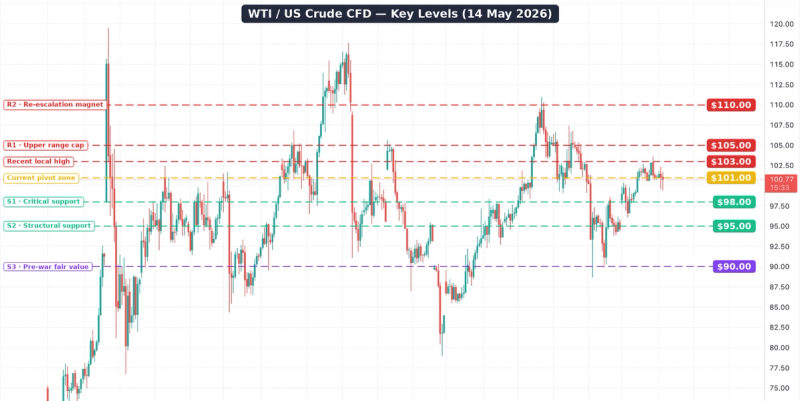
WTI US Crude Key Levels May 14th 2026
Key levels to watch out for
The visual confirms the thesis better than the prose did. Look at the WTI chart — every meaningful selloff since the Feb 28 escalation has held above $90, every meaningful rally has been capped between $108–$117, and we are sitting almost exactly in the middle of that range right now at $100.77. The market has, in technical language, drawn its own confidence interval around the war-risk premium and has been respecting it for ten weeks. That is not random.
On Brent, the $108 line is the one to watch this week. It's been touched as both resistance and support multiple times — early April, mid-April, and the May 6–10 consolidation. A daily close above $108 with the current diplomatic backdrop would be the tape calling the de-escalation a fade and reaching for $110+. A rejection here is the cleanest short setup on either chart, with stop above $110 and target $103.
The WTI $98 level is more important than it looks. The May 6 panic low printed almost exactly there before bouncing. It's the technical line that separates "war premium intact" from "war premium unwinding." If the diplomatic headlines accelerate over the weekend and Sunday futures gap below $98, you'll know the tape has decided the Chinese-vessel story is real. If they hold, the bid returns.
The current pivot bands ($101 WTI / $106 Brent) are where the algos are positioned. Most days, that's where price will mean-revert to. Your edge is in the extremes — fading the pushes toward resistance, accumulating near the supports, and respect the $90 / $95 floors as the hard line where the whole bullish structure either gets reaffirmed or breaks.
Three trade structures to actually think about
Before you read the following, do note that we’re not telling you how to trade. We’re sharing with you how to think about clicking on the buy and sell buttons on your MT 5 trading terminal.
Structure 1 — The "headline fade" long. If the market drifts US Crude back to $98.50–99.00 on some diplomatic euphoria, you may have an opportunity for an asymmetric long. Stop $96.50. First target $103. Second target $108. Why does it work? Because the de-escalation narrative requires non-Chinese tankers to cross the Strait insured, and you are betting the news cycle gives you a re-escalation headline before the physical confirmation arrives. The risk premium is being given to you cheap.
Structure 2 — The "show me the cargo" short. This is the trade we respect even though I disagree with it. If US Crude breaks $98 on a daily close with volume, and Lloyd's removes the war-risk surcharge on insurance for oil tankers, and a Japanese or Indian-flagged tanker successfully exits the Gulf, then short on the retest of $98 from below, target $93, stop $101. But notice how many "ands" are in the sentence above. Three confirmations – the market is currently pricing one so let’s be patient.
Structure 3 — The cleanest expression: range fades. Until something physical changes, US Crude is in a $98–$110 envelope and Brent in a $103–$115 envelope. Sell the upper third, buy the lower third, accept that you'll lose if the regime breaks. For now on most days one won't lose of they employ this approach.
The question on every trader’s mind
Aramco's CEO, who runs the largest oil company on Earth, told investors this week that even if the Strait of Hormuz opened today, it would still take months for the market to rebalance — and if its opening is delayed by a few more weeks, normalization will last into 2027. Not mere months, quarters and into 2027. Time to get realistic and update your bias despite your views of Iran’s or Trump’s policies, or daily headlines.
The market is debating whether to short oil because a Chinese tanker that was already crossing the Strait now has Tehran's permission slip. And because two presidents who met for two hours agreed that, in principle, oil should flow. You decide, but make that decision because you've thought about the cargo, not because Trump or Reuters told you to take a view.
This material is a marketing communication provided for informational purposes only and does not constitute investment advice, recommendation, or an offer or solicitation to trade. Any market analysis, opinions, or forecasts are based on publicly available information and do not constitute independent investment research. Past performance and forecasts are not reliable indicators of future results. Scope Markets accepts no liability for any loss arising from reliance on this information.
Related Articles

Technical Scope: Markets Await Fresh Catalysts
By Mohanad Yakout
Welcome to today’s edition of The Technical Scope, your twice-weekly guide to the evolving landscape of global markets through the lens of technical a...
Read More
Market Analysis
Swing Trading
Technical Analysis

Technical Scope: Markets see trend continuations
By Mohanad Yakout
Welcome to today’s edition of The Technical Scope, your twice-weekly guide to the evolving landscape of global markets through the lens of technical a...
Read More
Market Analysis
Swing Trading
Technical Analysis

Technical Scope: Price Action Ahead of the Peace Summit
By Mohanad Yakout
Welcome to today’s edition of The Technical Scope, your twice-weekly guide to the evolving landscape of global markets through the lens of technical a...
Read More
Market Analysis
Price Action
Swing Trading
Technical Analysis

Technical Scope: The Sideways trading continues
By Mohanad Yakout
Welcome to today’s edition of The Technical Scope, your twice-weekly guide to the evolving landscape of global markets through the lens of technical a...
Read More
Market Analysis
Swing Trading
Technical Scope: No changes in technicals, or fundamentals!
By Mohanad Yakout
Welcome to today’s edition of The Technical Scope, your twice-weekly guide to the evolving landscape of global markets through the lens of technical a...
Read More
Market Analysis
Technical Analysis
Swing Trading
Technical Scope: The Strong Dollar Effect
By Mohanad Yakout
Welcome to today’s edition of The Technical Scope, your twice-weekly guide to the evolving landscape of global markets through the lens of technical a...
Read More
Market Analysis
Technical Analysis
Technical Scope: Markets stuck in a sideways range
By Mohanad Yakout
Welcome to today’s edition of The Technical Scope, your twice-weekly guide to the evolving landscape of global markets through the lens of technical a...
Read More
Market Analysis
XAUUSD
USDJPY
US 500
Trend Following
Technical Analysis
Swing Trading
Support And Resistance

Technical Scope: Markets Mixed Ahead of Key Developments
By Mohanad Yakout
Welcome to today’s edition of The Technical Scope, your twice-weekly guide to the evolving landscape of global markets through the lens of technical a...
Read More
Market Analysis
XAUUSD
USDJPY
US 500
Trend Following
Technical Analysis
Swing Trading
Support And Resistance
Technical Scope: Key Levels & Market Outlook ahead of NFP Data
By Mohanad Yakout
Welcome to today’s edition of The Technical Scope, your twice-weekly guide to the evolving landscape of global markets through the lens of technical a...
Read More
Market Analysis
Chart Patterns
Candlestick Patterns
Day Trading
GBPUSD
Gold
NFP
Non Farm Payrolls
EURUSD
Oil
S&P 500
US 500
USDJPY
XAUUSD

The state of Hormuz: oil price action is not the story
By Victor Golovtchenko
Another month, another week, another batch of headlines, and new all-time highs for US stock markets might not be the news one awaits when they see th...
Read More
Market Analysis
Oil
WTI
Brent Crude
Strait of Hormuz
UAE
OPEC